
IDM (Innovation Development Marketing) South Tyrol provides services with the aim of promoting sustainable development of the local economy and consequently increasing the competitiveness of South Tyrolean companies.
IDM asked us to digitize the paper report that every year collects data on overnight stays and arrivals in South Tyrol, with the aim of:
• reduce the use of printed paper
• offer updated data over time
• allow comparison and interaction between data
• offer updated data over time
• allow comparison and interaction between data
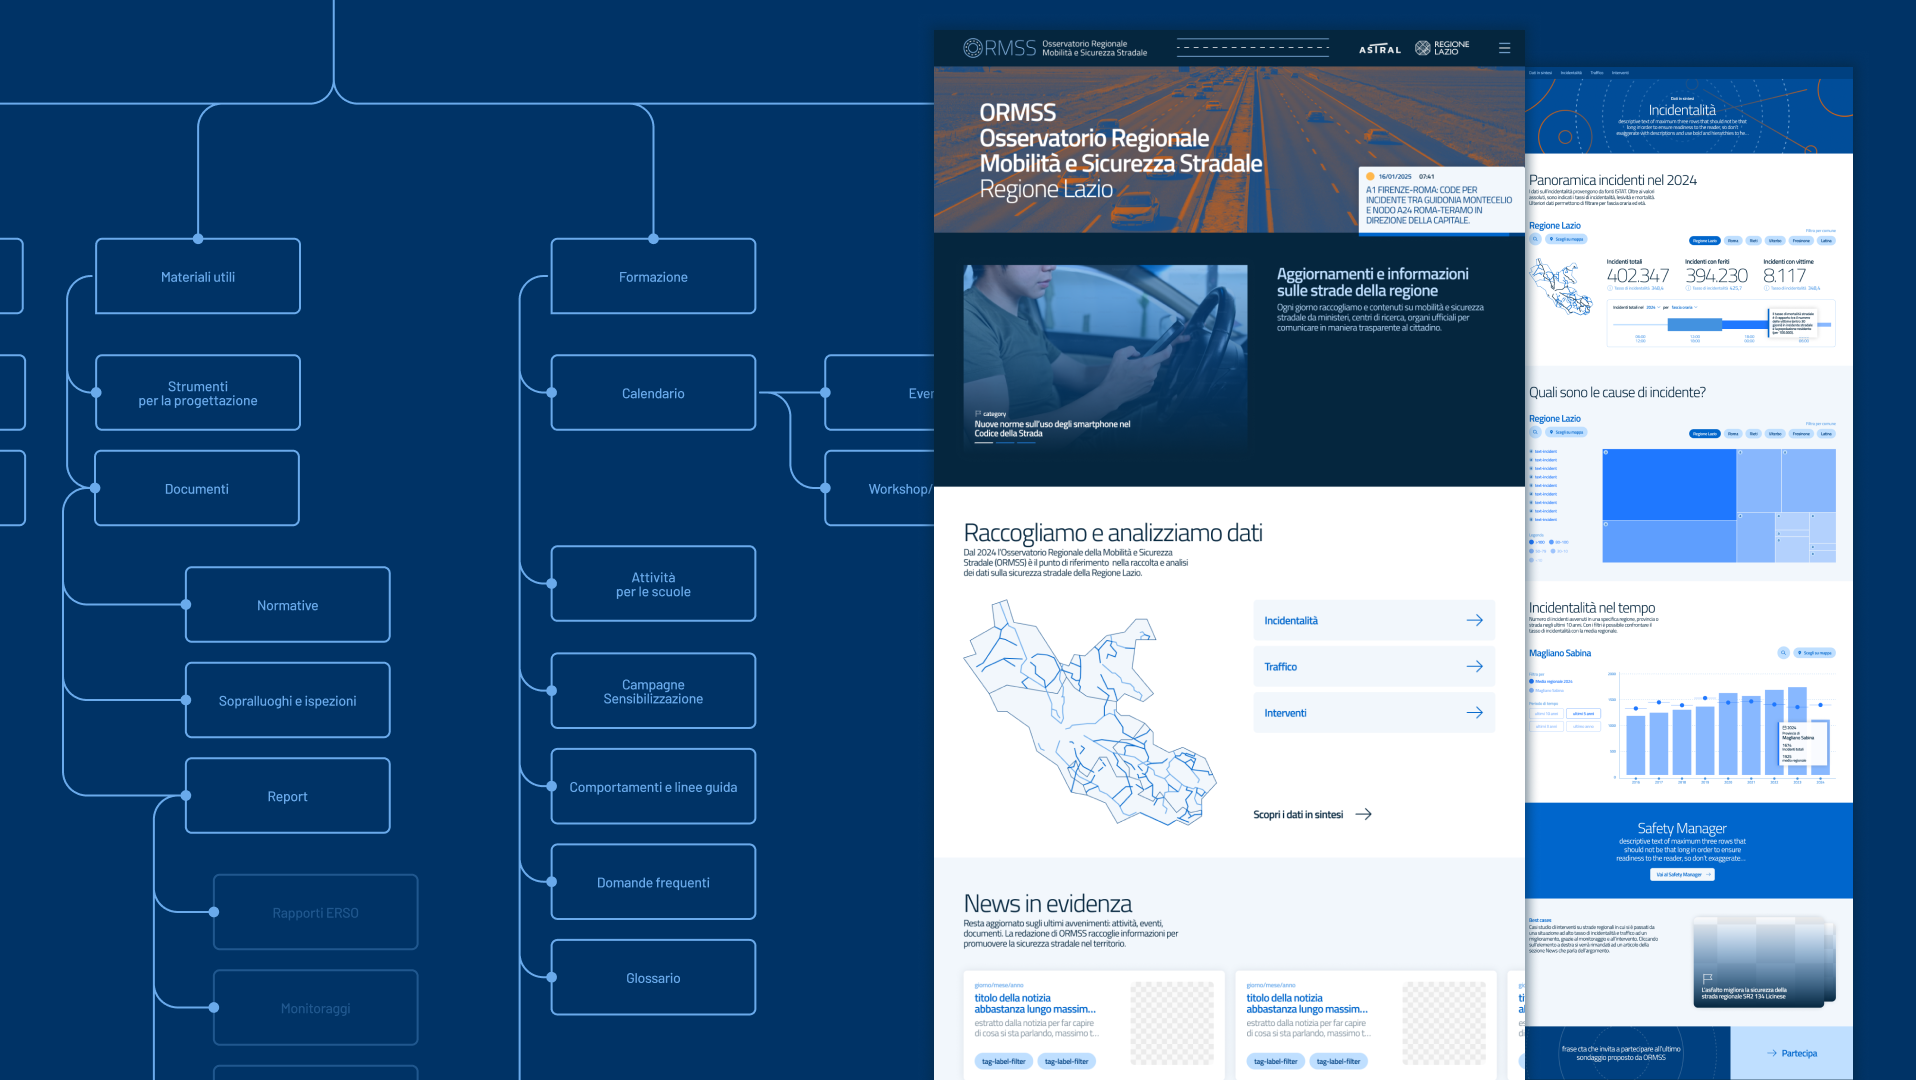
The proposed solution is a data visualization web application in Italian and German, optimized for desktop and mobile, with a database for the last five years.
UX Design
We identified with a user interested in consulting data on tourism and the territory: what questions would he ask himself? What would he be looking for?
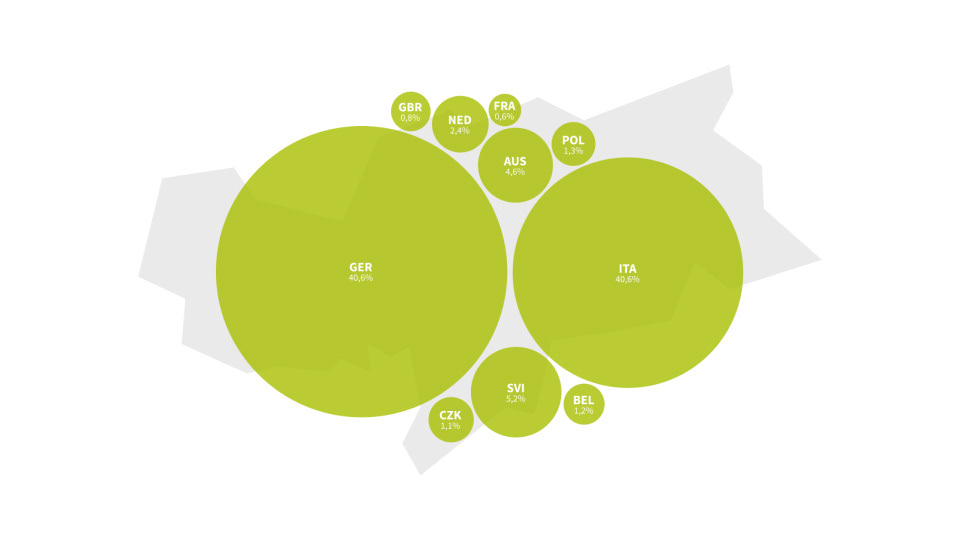
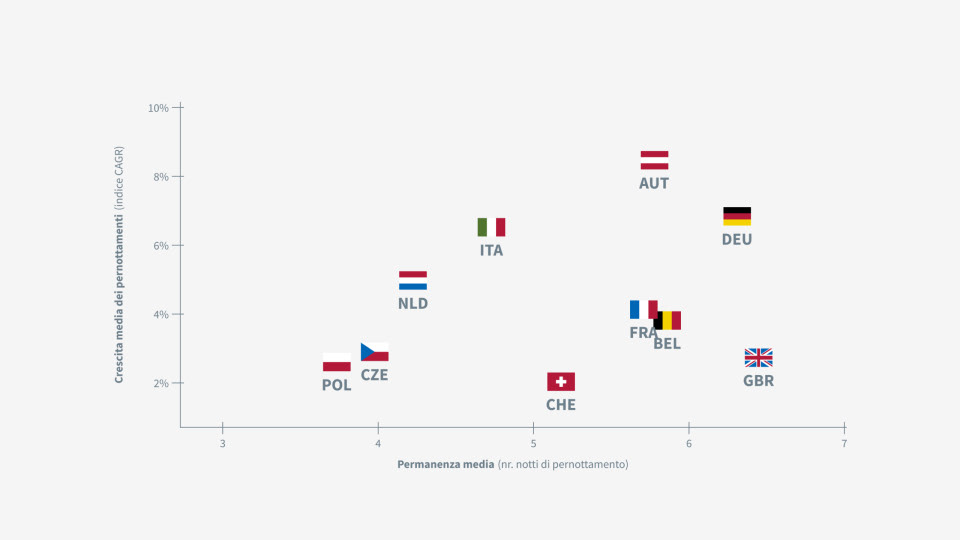
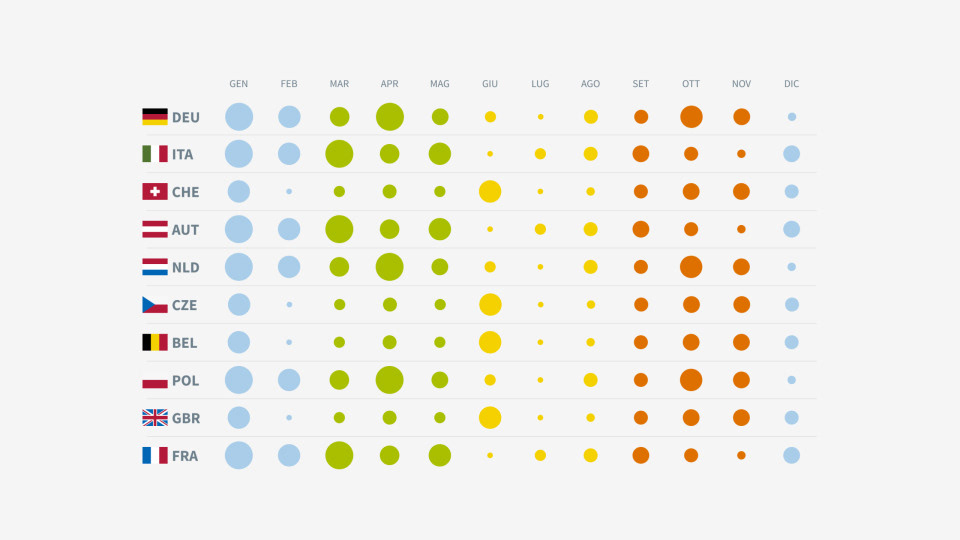
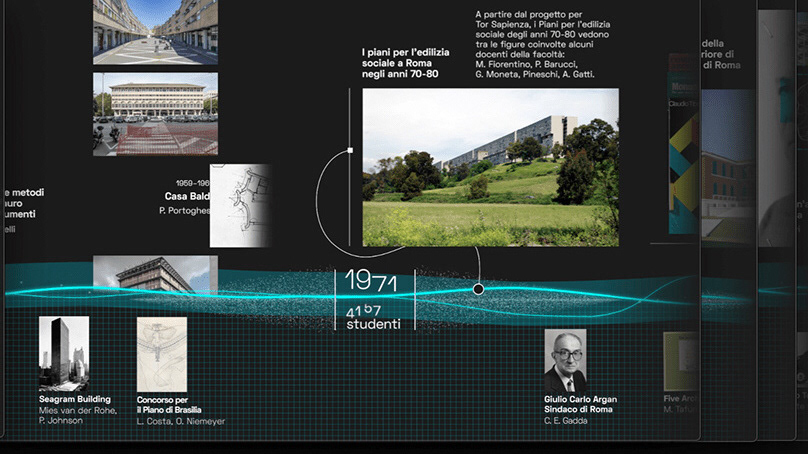
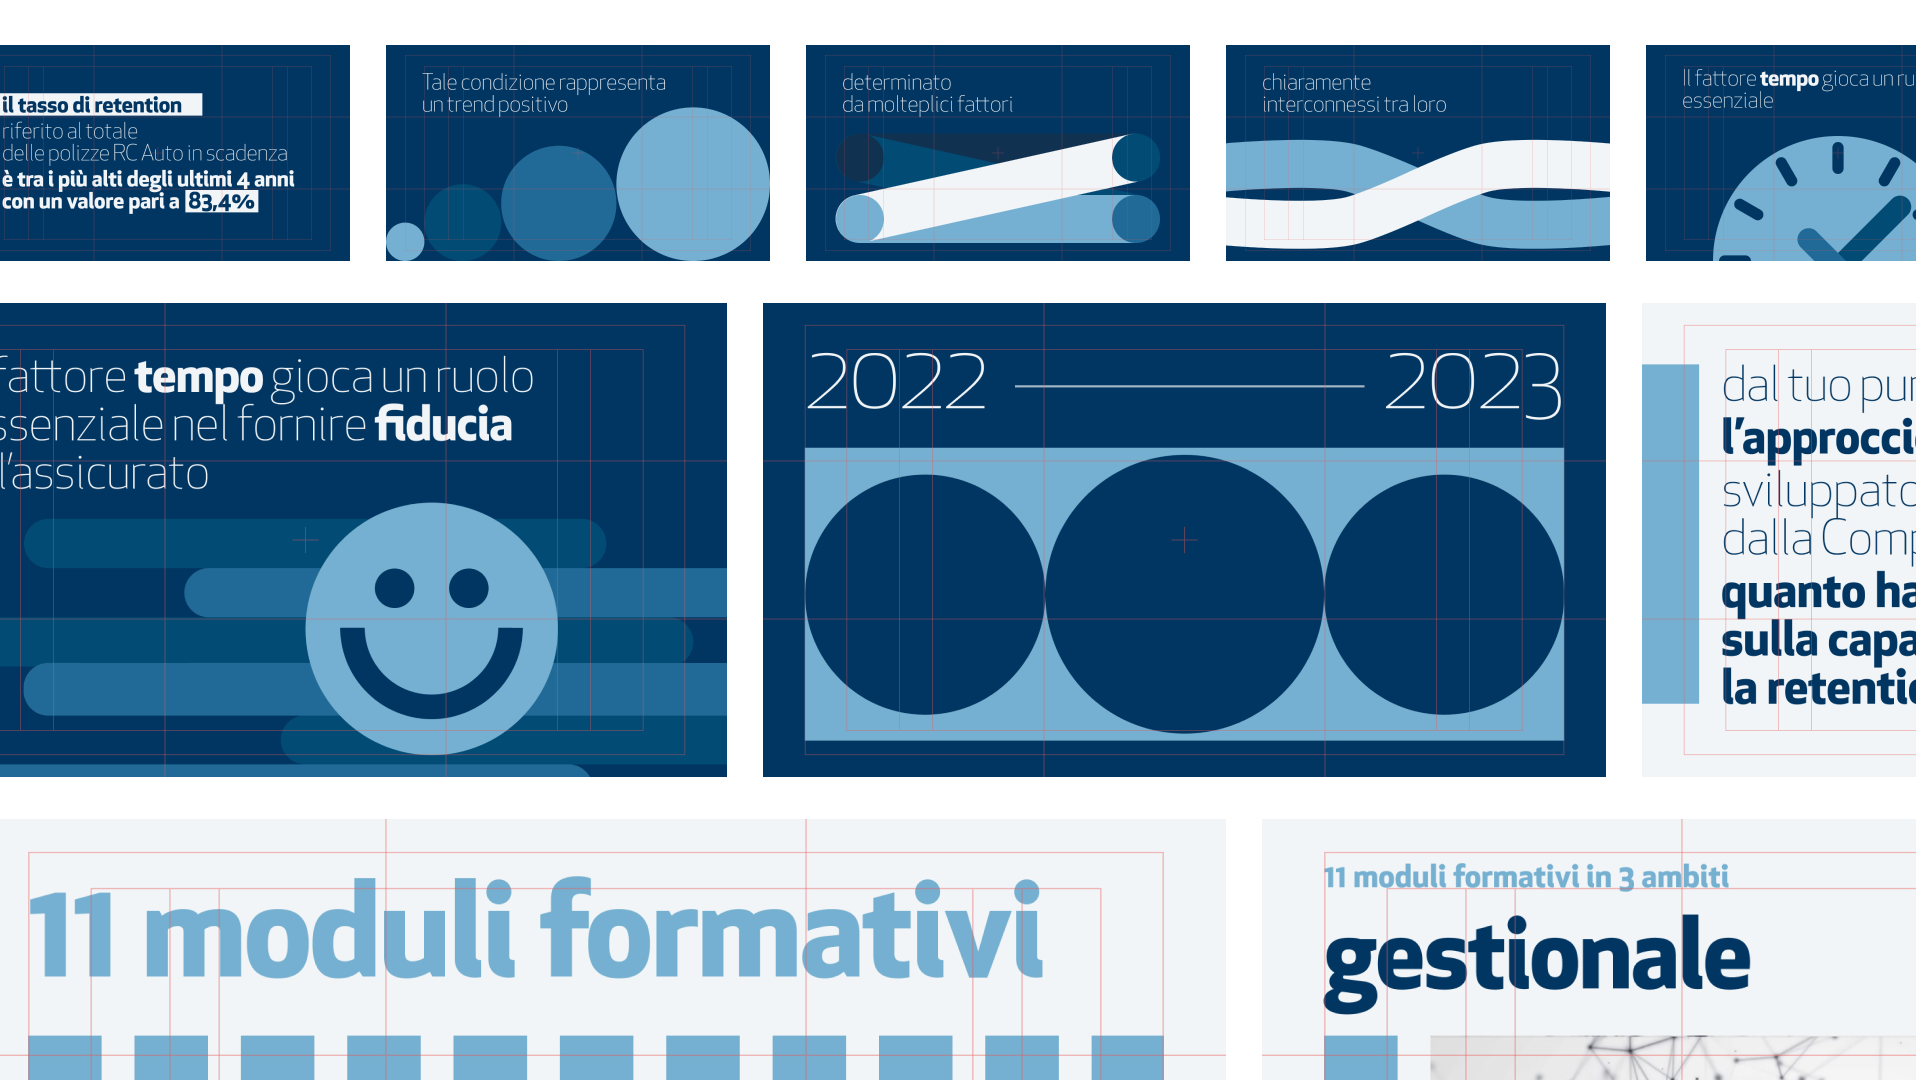
For each question, we associated one or more data tables, crossing the information by time clusters, territorial contexts or market areas. Through a storyline of interactive graphics, narration is the method chosen to guide the user in navigation.
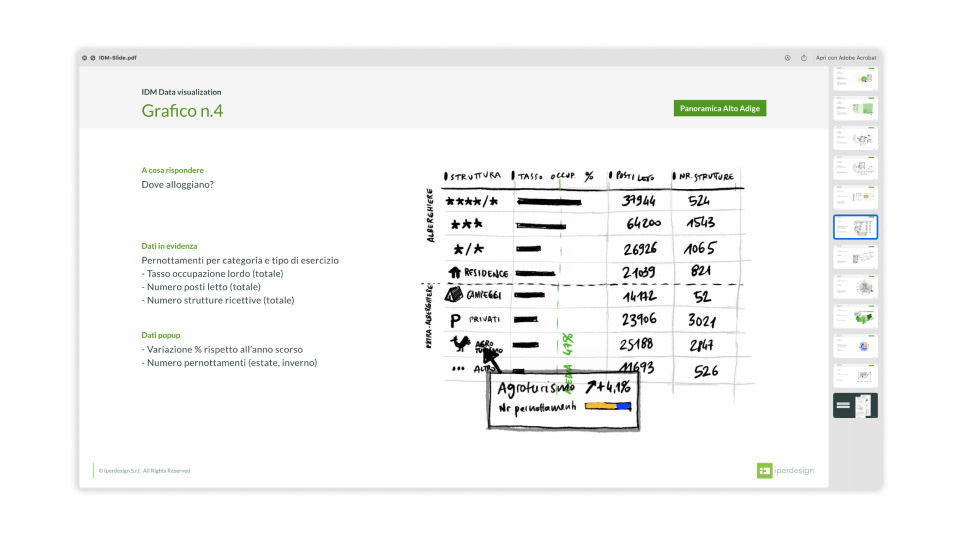
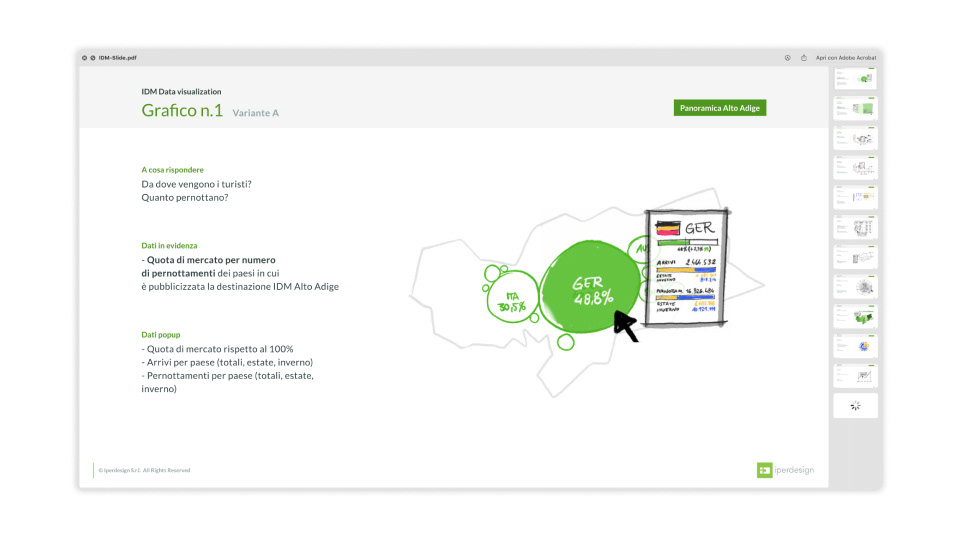
Sketch, design and prototype
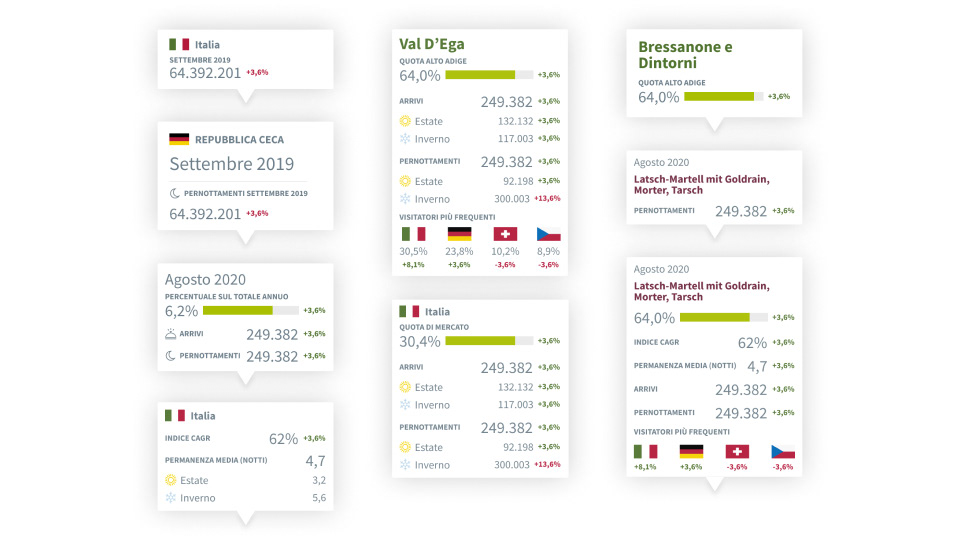
From raw and tabular data to visualization. The sketches - manual first and then digital - helped us to understand which were the most suitable graphics to tell specific groups of information.To focus attention on one content at a time, we chose a one-column layout and in-depth analysis through popups and filters.
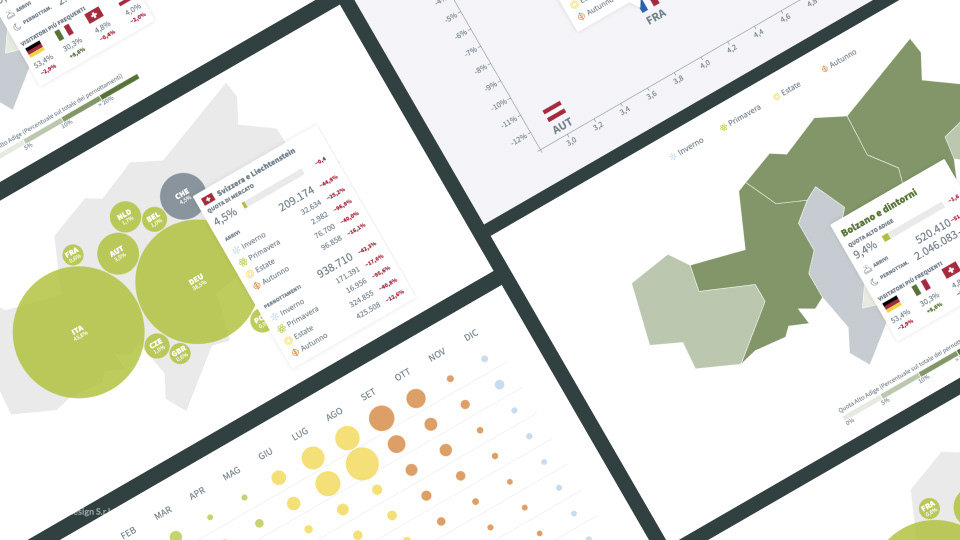
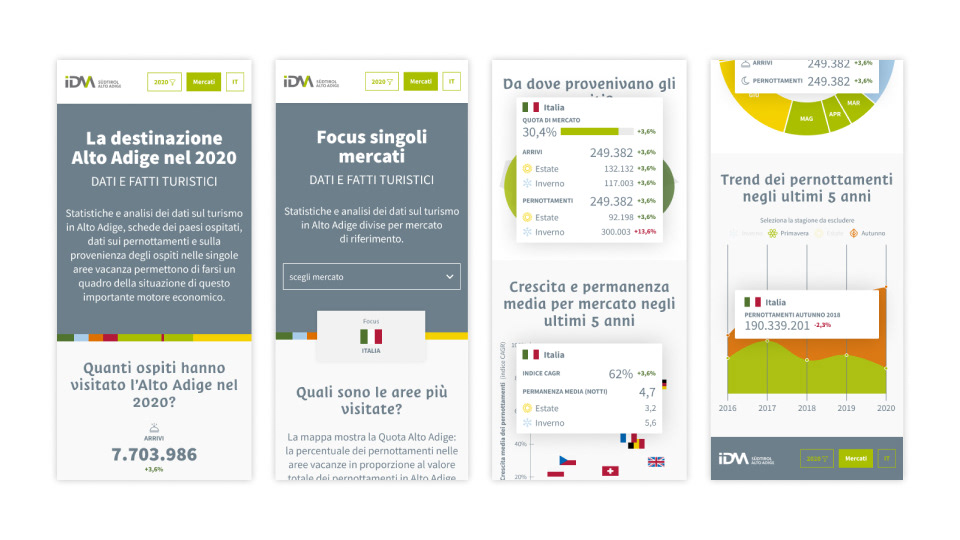
UI Design + Development
Popups are designed in such a way that they are the same size between desktop and mobile.
The typography has been weighted to be readable on all devices.
The modularity and hierarchy of titles, headings, textual and numerical elements gives life to a variable but coherent language.
The typography has been weighted to be readable on all devices.
The modularity and hierarchy of titles, headings, textual and numerical elements gives life to a variable but coherent language.
The D3.js library provided us with the starting points for the creation of interactive graphics. CSS allowed us to customize content by calibrating typography, colors and navigation assets. Thus was born a scalable system, expandable over time.